
Picture this: someone walks into your store, browses every shelf, picks up three products, and leaves without buying a thing.
Annoying, right?
Now imagine that same scenario playing out thousands of times every month on your website. Visitors arrive, poke around, and disappear into the internet abyss, while you sit there refreshing your Google Analytics page, wondering what the heck went wrong.
Here’s the uncomfortable truth: 98% of website visitors leave without identifying themselves. They never fill out a form, never subscribe to your newsletter, never buy anything. They just vanish. And most website owners have absolutely no idea who they were, what they wanted, or why they left.
Website visitor tracking tools change that equation entirely.
They pull back the curtain on your anonymous traffic. They show you which pages people visit, how long they stay, where they drop off, what they click, and sometimes, who they actually are.
That data isn’t just interesting. It’s the difference between a website that converts and one that bleeds traffic like a broken pipe.
The challenge in 2026 is that the market is flooded with tools making bold promises. Some track behavior. Some identify companies. Some do both. Some cost a fortune. Some are completely free. Picking the wrong one means paying for data you’ll never use.
This guide breaks down the best website visitor tracking tools tested, covering everything from behavioral analytics and heatmaps to SEO performance tracking and site traffic checking. Every tool has a clear use case. Zero guessing.
Let’s find yours.
Table of Contents
What Are Website Visitor Tracking Tools (And Why You Need Them)?
Website visitor tracking tools are software that monitor, record, and analyze how users interact with your website.
But here’s what most definitions miss: not all tracking tools do the same job. The market in 2026 has evolved into three distinct categories:
Behavioral analytics tools – Show you what visitors do on your site. Heatmaps, session recordings, scroll depth, click tracking. You see the experience through your visitor’s eyes.
Traffic analytics tools – Show you where visitors come from and how many are arriving. Organic traffic, direct, referral, social, paid; broken down by source, device, geography, keyword.
Visitor identification tools – Show you who is visiting. Especially useful for B2B companies who want to know which companies are browsing their pricing page at midnight.
The best setup uses at least two of these categories together. Traffic analytics tells you how many people showed up. Behavioral analytics tells you what they did when they arrived. Visitor identification tells you who they were.
Running all three means you have the complete picture. Running just one means you’re missing critical context.
8 Best Website Visitor Tracking Tools in 2026
1. CrawlWP – The “Where Did My Visitors Come From?” Answer
Best for: WordPress site owners who want to understand which search engines are sending visitors, which keywords brought them, and which pages are attracting the most organic traffic
The question every visitor tracking conversation skips:
Every visitor tracking article jumps straight to behavioral analytics. Heatmaps. Session recordings. Scroll depth. What visitors do once they land.
But before any of that matters, there’s a more fundamental question nobody answers first:
How did those visitors find you in the first place?
Because here’s the reality: if you don’t know which search keywords, which search engines, and which pages are pulling visitors to your site, you’re optimizing unquestioningly. You’re improving the experience for visitors who may or may not be the right visitors, arriving from channels you don’t fully understand.
CrawlWP solves this. It’s the traffic source layer of your visitor tracking stack; the tool that answers “where did they come from?” before Clarity or Hotjar answers “what did they do?”
What CrawlWP reveals about your visitors:
Which search engines send you visitors:
CrawlWP connects directly to Google Search Console, Bing Webmaster Tools, and Yandex, pulling SEO performance data from all three search engines into a single WordPress dashboard. You see exactly how many visitors each search engine sends you, not as an estimate, but as actual data straight from the source.
Most WordPress sites obsess over Google and completely ignore Bing (which powers Microsoft Copilot, DuckDuckGo, and Yahoo) and Yandex. CrawlWP makes ignoring them impossible by putting all three in front of you every time you log in to WordPress.
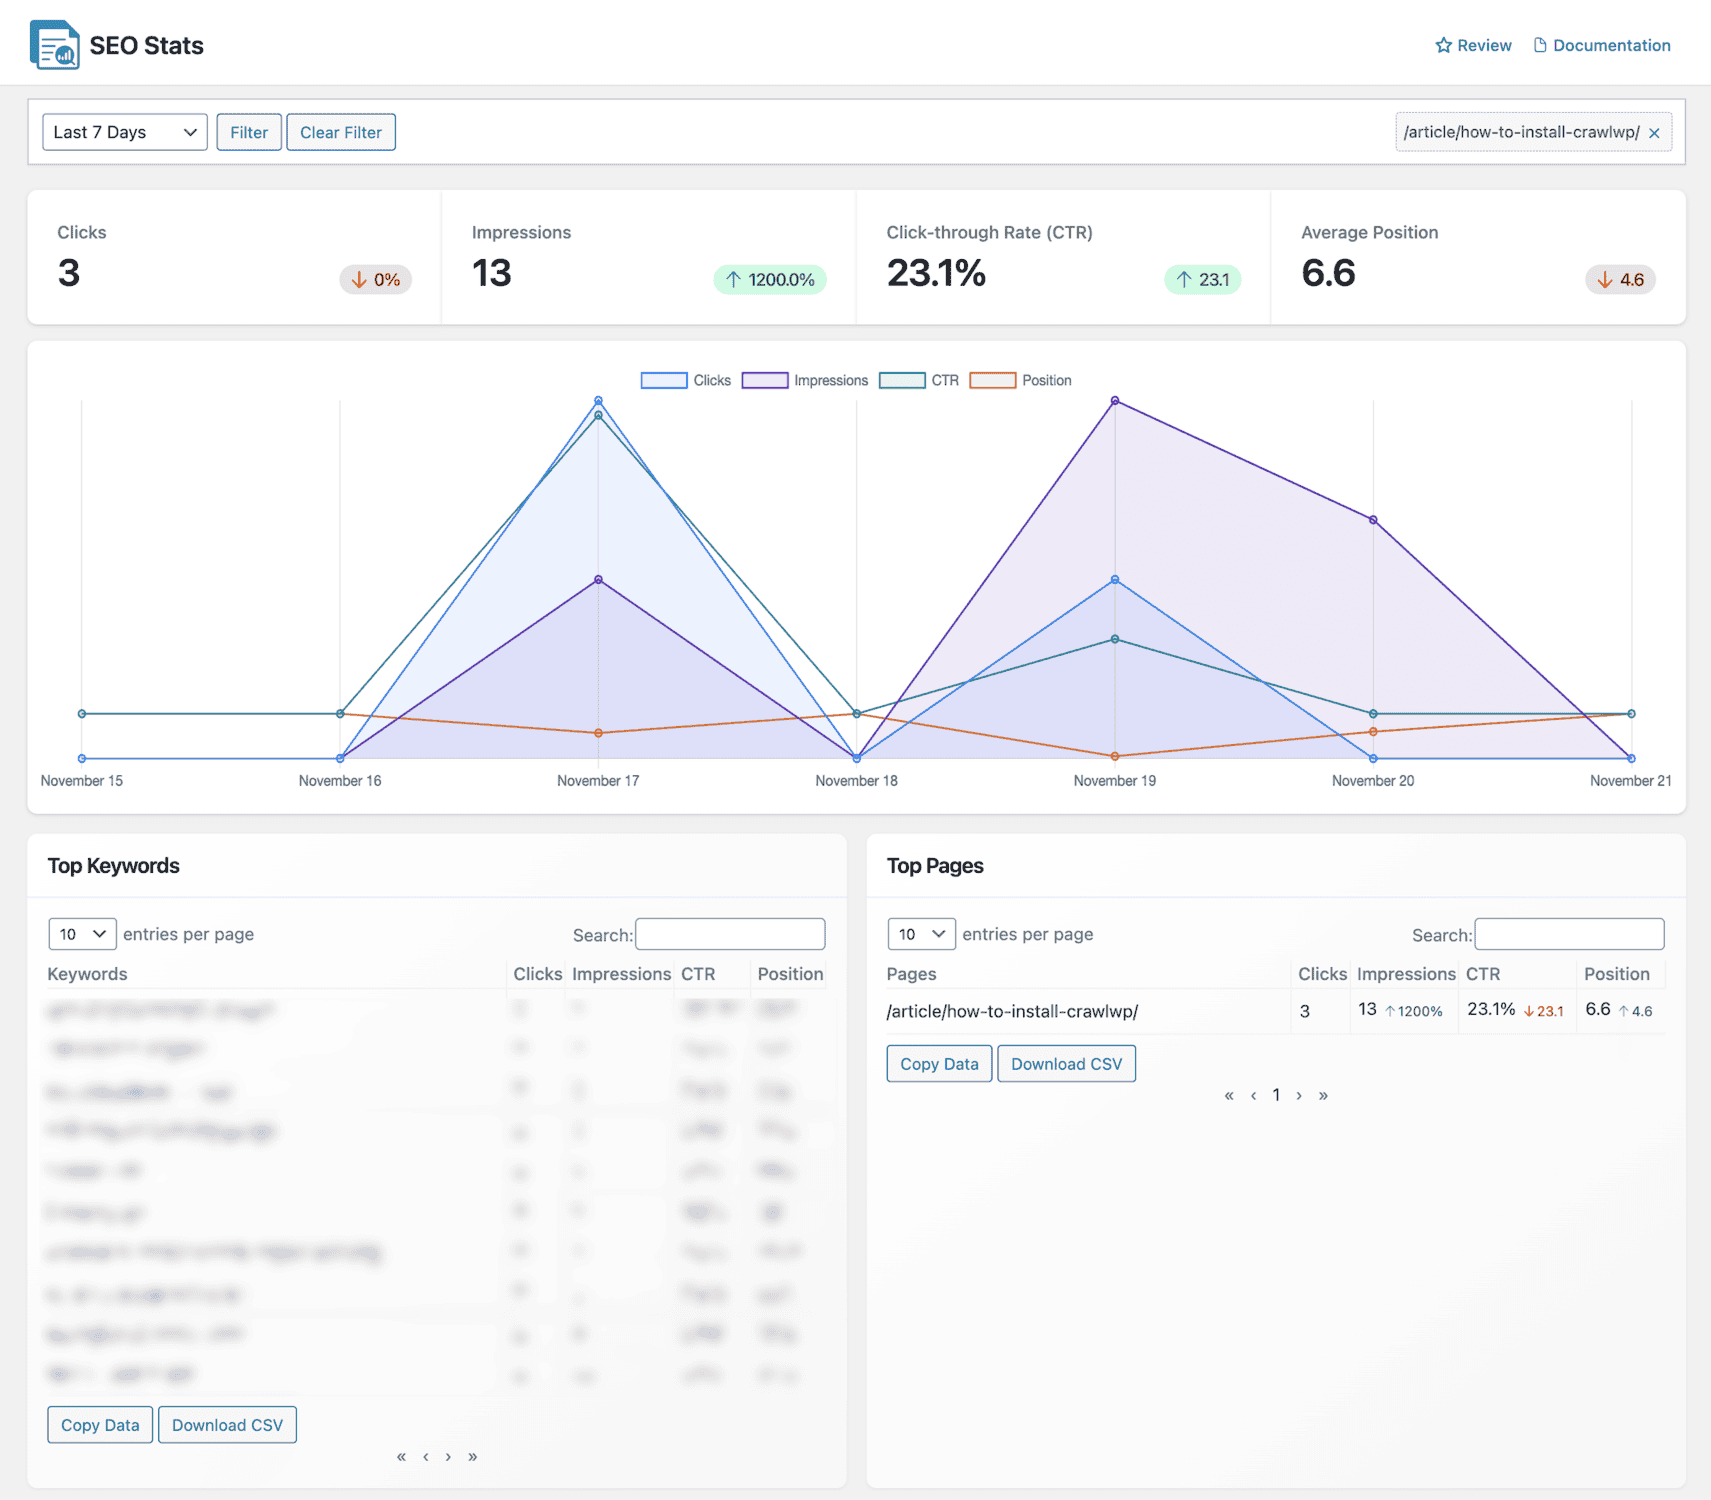
Which keywords bring visitors to your door:
The Top Keywords section shows every search term driving visitors to your WordPress website, including:
- How many visitors each keyword sent (clicks)
- How many times your site appeared in results for that keyword (impressions)
- What percentage of searchers clicked through (CTR)
- Where your page ranks on average for that keyword (position)
This is gold for understanding your actual visitor intent. When you know someone searched “free WordPress indexing plugin” and landed on your site, you know exactly what problem they walked in with.
That context transforms how you think about every other visitor tracking metric downstream.
Which pages attract the most organic visitors:
The Top Pages section shows which content is actively pulling visitors from search engines. High impressions but low CTR? Your title tag isn’t compelling enough to make people click. High clicks but visitors leave immediately? There’s a mismatch between what the keyword promised and what the page delivered.
This is where CrawlWP bridges the gap between visitor tracking and SEO. The behavioral tools indicate that visitors are leaving quickly. CrawlWP tells you which keyword brought them and what expectation they arrived with. Together, you can fix the problem.
Where in the world your visitors are coming from:
The Top Countries section breaks down visitor performance by geography, clicks, impressions, CTR, and position for each country. If you’re accidentally attracting significant traffic from a country you’ve never targeted, that’s an audience worth understanding and potentially serving better.
What devices your visitors use:
Mobile, tablet, desktop: split by actual visitor data from search engines. If 70% of your search visitors arrive on mobile but your mobile experience scores poorly in Core Web Vitals, CrawlWP surfaces that gap directly.
The visitor pipeline CrawlWP completes:
Think of website visitor tracking as a pipeline with three stages:
Stage 1 — Discovery: How did visitors find you? → CrawlWP answers this. Keywords, search engines, page rankings, geographic origin.
Stage 2 — Behavior: What did visitors do once they arrived? → Microsoft Clarity, Hotjar, or Lucky Orange answer this. Heatmaps, session recordings, scroll depth.
Stage 3 — Identity: Who were those visitors specifically? → Leadfeeder answers this (for B2B). Company names, firmographics, visit frequency.
Most teams run Stage 2 and Stage 3 without Stage 1. They know what visitors do and sometimes who they are. But they don’t understand the search intent that brought those visitors in the first place. That’s the gap CrawlWP fills, and it’s not a small gap.
The indexing advantage:
Beyond tracking, CrawlWP actively notifies Google, Bing, and Yandex the instant you publish or update content. New pages get indexed within 24-48 hours instead of the typical 5-14 day wait.
This matters for visitor tracking because unindexed pages attract zero organic visitors. Before you can track visitors arriving from search, those visitors have to be able to find you. CrawlWP handles both sides: getting you found and showing you who found you.
What 40,000+ WordPress site owners use it for:
Understanding which search keywords drive real visitors. Identifying pages with high visibility but low click-through (meaning the page appears in results, but something about the title or description stops visitors from clicking). Spotting keyword opportunities where rankings are close to page 1 but haven’t broken through yet.
All of this feeds directly into smarter visitor acquisition before the behavioral tracking tools even come into play.
Pricing:
- Free: Submitting WordPress content to search engines, ensuring they get indexed
- Paid plans: from $59/year (SEO Stats, auto-indexing, email performance reports, priority support)
Best paired with: Microsoft Clarity (free behavioral analytics). CrawlWP tells you which keyword sent a visitor. Clarity shows you what that visitor did when they arrived. That combination, search intent plus on-site behavior, is more powerful than either tool alone.
See where your visitors are really coming from with CrawlWP →
2. Google Analytics (GA) – The Traffic Analytics Foundation
Best for: Understanding where ALL your website traffic comes from, not just organic search
The wake-up call :
Every website needs Google Analytics. Not because it’s perfect (it isn’t; the interface is a maze wrapped in a spreadsheet wrapped in a nightmare). But because it’s the most comprehensive free traffic analytics tool on the planet.
GA accurately tracks every visitor to your site because you installed the tracking code directly. No estimates. No approximations. Real numbers from real sessions.
What GA shows you:
- Total sessions and users: How many people visited and how many were unique
- Traffic sources: Organic search, direct, referral, social media, email, paid ads, fully broken down
- Organic traffic trends: Is your SEO working? GA shows you month-over-month organic traffic patterns
- Landing pages: Which pages people arrive on first
- User journey: Where visitors go after landing and where they drop off
- Conversions: Purchases, signups, form submissions, whatever you define as a goal
- Real-time data: Who’s on your site right now
Why Google Analytics matters for site traffic checking:
Google Analytics gives you the full picture of site traffic. CrawlWP shows you your search engine performance specifically. Run both together, and you understand your total traffic (GA) and exactly which search keywords and rankings are driving it (CrawlWP).
Limitations:
- Only works for your own site (can’t check competitor traffic)
- The new GA4 interface is genuinely difficult for beginners
- Doesn’t show session recordings or heatmaps (behavioral data)
- Ad blockers prevent 15-25% of users from being tracked
Pricing: Free
Pro tip: Connect Google Analytics to Google Search Console to access keyword-level data in GA. Then use CrawlWP to display the same data more cleanly in WordPress.
3. Microsoft Clarity – The Free Behavioral Analytics Champion
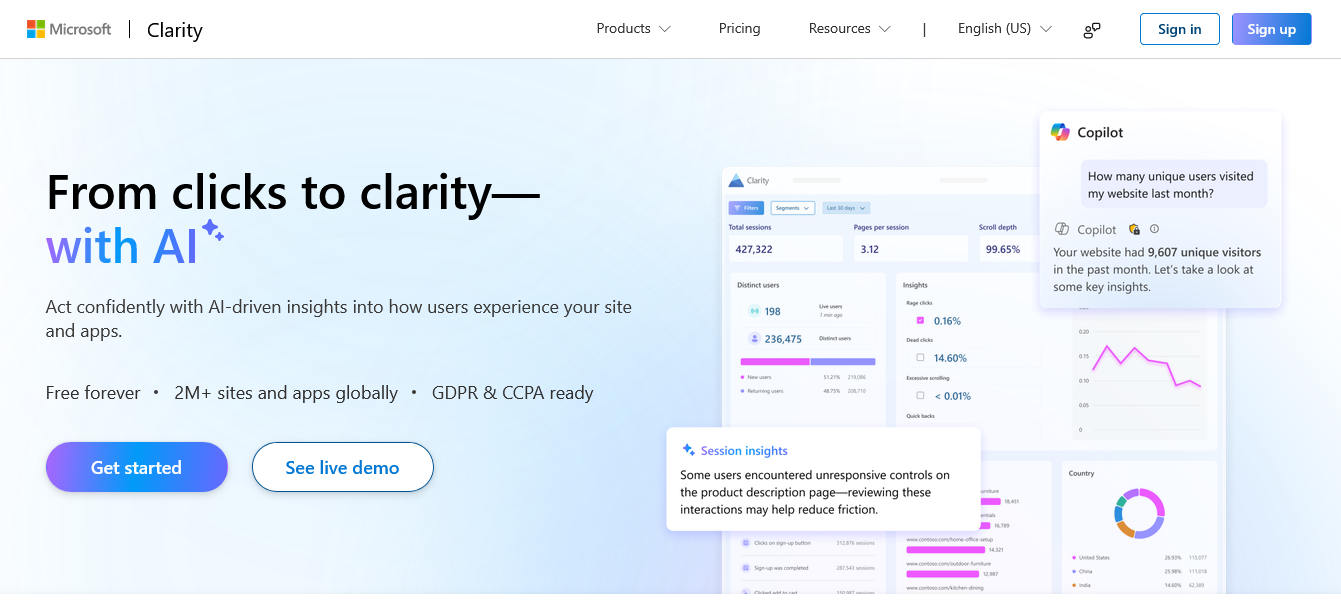
Best for: Understanding what visitors actually DO on your pages (without paying anything)
The bold claim: Microsoft built a full-featured behavioral analytics platform and made it completely free. Unlimited users. Unlimited sessions. No data sampling. No hidden costs.
That’s either incredibly generous or a very strategic move to drive Bing adoption. Probably both. Either way, you benefit.
What Clarity shows you:
Heatmaps (three types):
- Click maps: Where users click, including where they’re clicking on non-clickable elements (a reliable sign that your UX is confusing them)
- Scroll maps: How far down the page users scroll before leaving. If your CTA is below where 80% of users scroll, that’s your problem identified
- Area heatmaps: Click density within specific sections of a page
Session recordings:
- Watch real visitor sessions like a movie
- See mouse movements, clicks, scrolls, rage clicks (frustrated repeated clicking), dead clicks (clicking non-clickable things), and quick backs (arriving and immediately leaving)
- Filter recordings by device, location, traffic source
- Up to 13 months of data retention
AI-powered insights:
- Automatic frustration signal detection
- Copilot integration for natural language queries about your data
- Anomaly alerts when behavior patterns change suddenly
Limitations:
- No visitor identification (you see behavior, not who the person is)
- No funnel tracking built in
- Requires setup of custom events for advanced analysis
Pricing: Completely free. No credit card. No trial period. Just free.
Best combo: Microsoft Clarity (behavior) + CrawlWP (organic traffic source) + Google Analytics (total traffic). Three free tools covering every angle of visitor understanding.
4. Hotjar – The UX Research Classic
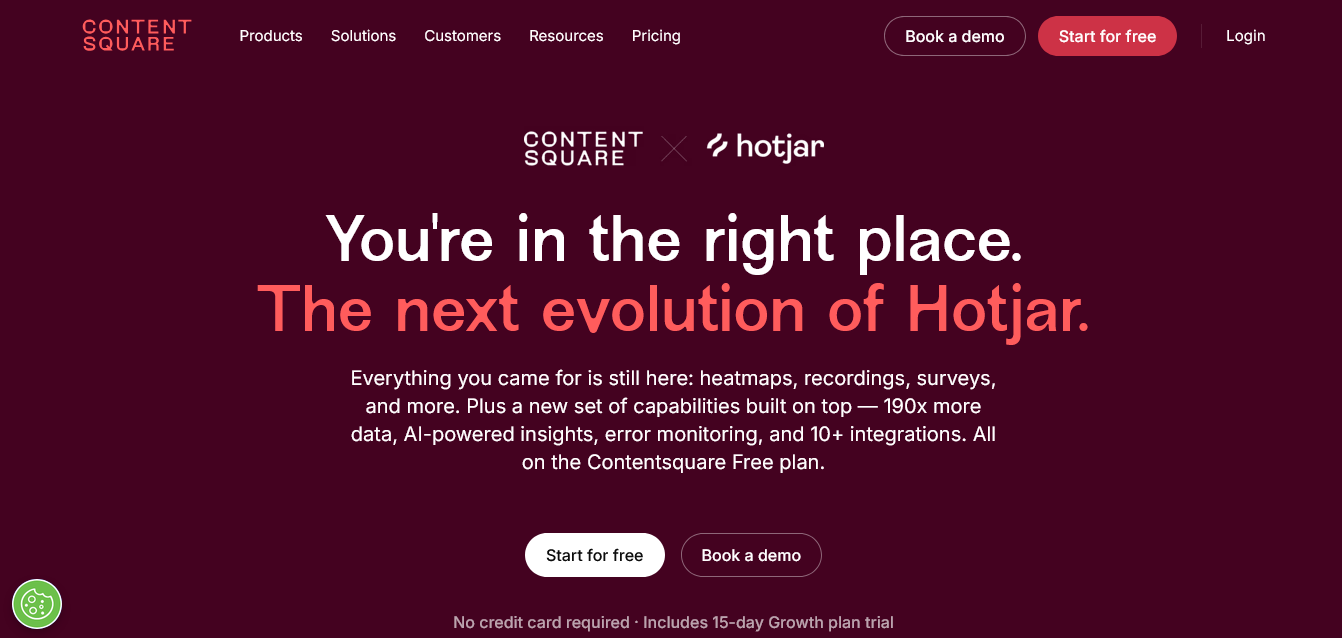
Best for: Teams that need behavioral analytics PLUS direct visitor feedback in one platform
The Hotjar difference:
Hotjar does what Clarity does: heatmaps, session recordings, scroll analysis, but adds one critical layer Clarity doesn’t have: direct user feedback collection.
With Hotjar, you can ask visitors why they’re leaving (exit surveys), what’s confusing them (on-page surveys), and how satisfied they are (NPS surveys). You’re not just observing behavior. You’re asking about it.
What Hotjar includes:
- Click, scroll, and move heatmaps
- Session recordings with filter options by traffic source, device, behavior, and more
- Feedback widgets: Let visitors report issues directly on the page
- Surveys: Deploy targeted questions based on what visitors do (e.g., trigger a survey after 30 seconds on the pricing page)
- User interviews: Built-in tool for scheduling and conducting UX research sessions
Why behavioral data matters:
Understanding visitor behavior helps you optimize user experience. If session recordings show visitors consistently rage-clicking a button that doesn’t work on mobile, that’s a fix worth making before you spend another dollar on ads.
Limitations:
- More expensive than Clarity for comparable features
- Data sampling on lower plans means you’re not seeing every session
- No visitor identification
Pricing: Paid plans start at $49/month
Best for: Product teams, UX designers, conversion rate optimization specialists who need both behavioral data and direct user feedback.
5. Crazy Egg – The A/B Testing + Heatmap Combo
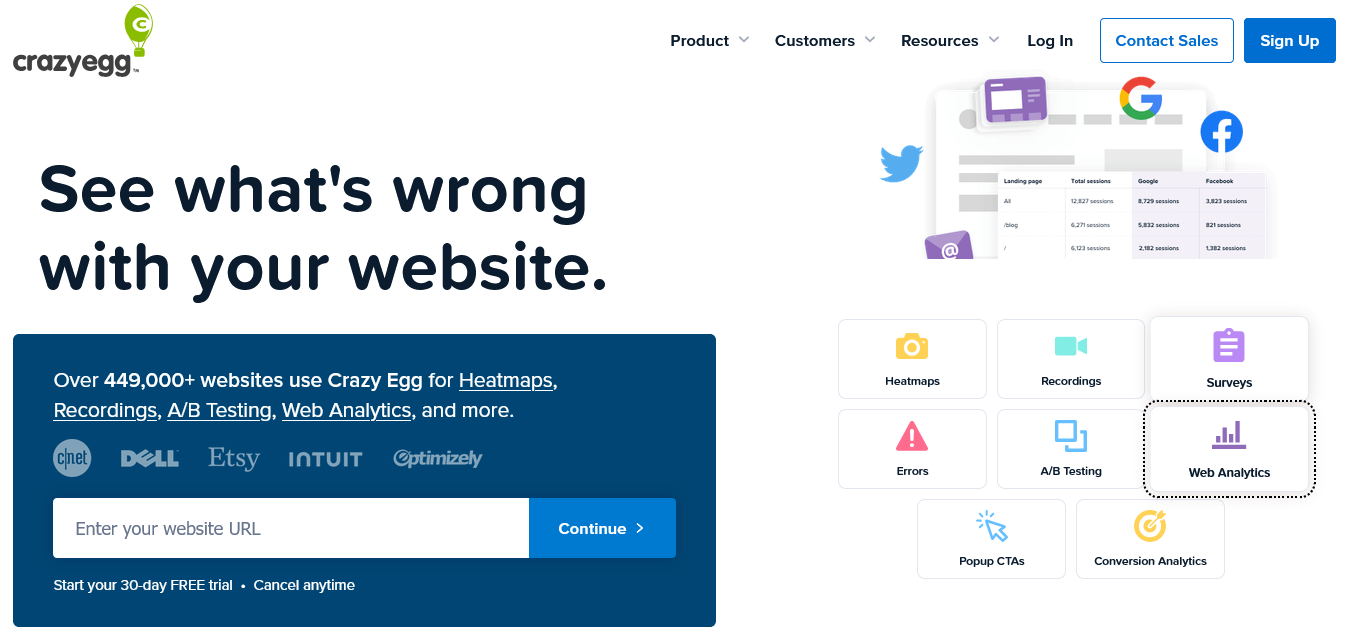
Best for: Teams who want to test improvements directly rather than observe problems
The Crazy Egg angle:
Most behavioral analytics tools show you problems. Crazy Egg shows you problems AND lets you test fixes all in the same platform. The heatmap identifies that users aren’t clicking your CTA.
The A/B testing tool lets you create an alternative version and test whether the change actually helps.
That closed feedback loop is genuinely valuable.
What makes Crazy Egg different:
- Confetti heatmaps: Segment clicks by referral source, search term, operating system, and more. See whether paid traffic and organic traffic behave differently on the same page
- Traffic analysis overlay: See which traffic segments interact with which page elements
- A/B testing: Create page variants without coding, run split tests, measure conversion impact
- Session recordings: Watch visitor journeys that correspond to heatmap patterns
- Error tracking: Identifies JavaScript errors and broken elements causing user frustration
Limitations:
- More expensive than Clarity without offering dramatically better core features
- A/B testing functionality is somewhat limited compared to dedicated testing tools
- No visitor identification
Pricing:
- Starter: $29/month (5,000 pageviews/month)
- Plus: $99/month (150,000 pageviews/month)
- Pro: $249/month (500,000 pageviews/month)
- Enterprise: $599/month (1,000,000pageviews/month)
Best for: Marketers who want to identify UX problems and test solutions without switching tools. Particularly useful for landing page optimization.
6. Leadfeeder – The B2B Company Identifier
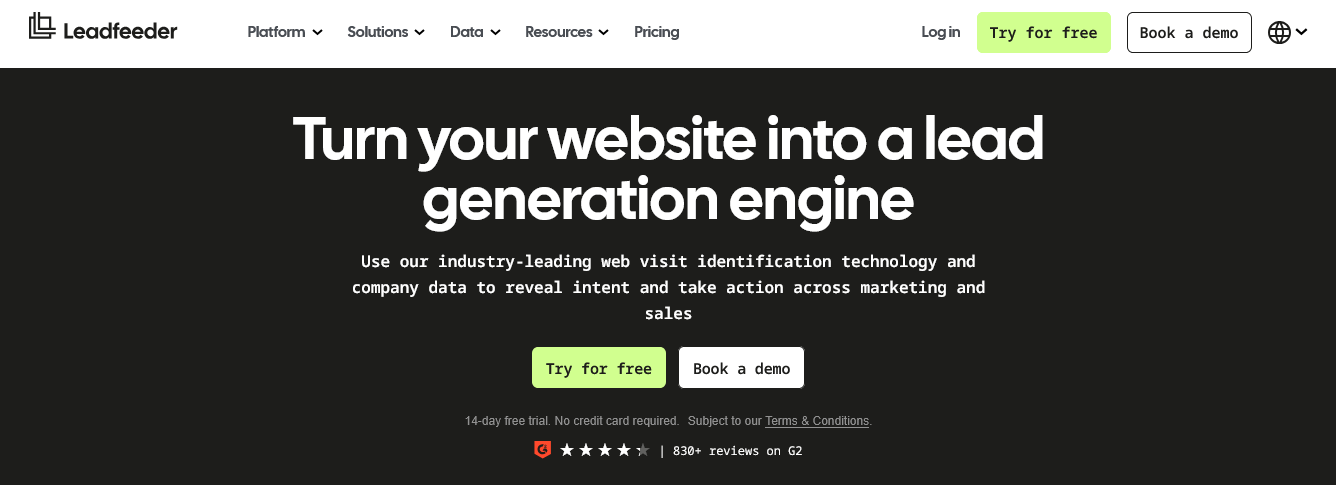
Best for: B2B companies who want to know which companies are visiting their site
The B2B revelation:
For B2B businesses, knowing that “somebody” visited your pricing page is not enough. Knowing that Acme Corp visited your pricing page three times this week is actionable intelligence.
Leadfeeder (rebranded as Dealfront) identifies the companies behind anonymous B2B website visits using IP-to-company matching technology.
What Leadfeeder shows you:
- Company identification: Which businesses are visiting your site (not individual names; company level)
- Visit behavior: Which pages they viewed, how long they stayed, how many times they’ve visited
- Firmographic data: Company size, industry, location, revenue range
- CRM integration: Push identified accounts directly into HubSpot, Salesforce, Pipedrive
- Slack/email alerts: Get notified when a target account visits your site
Use case:
Your sales team is working on closing Acme Corp. Leadfeeder alerts you that someone from Acme Corp just visited your pricing page and then your case studies page. That’s hot buying intent. Your sales rep reaches out. Timing is everything.
Limitations:
- Company-level only (not person-level identification)
- Remote workers showing home IP addresses are invisible
- Match rates for smaller companies can be lower
Pricing: Paid plans start at €113/month
Best for: B2B SaaS companies, agencies, professional services; any business where knowing which companies are interested is more valuable than knowing what individual users clicked.
7. Mouseflow – The Funnel + Form Analytics Specialist
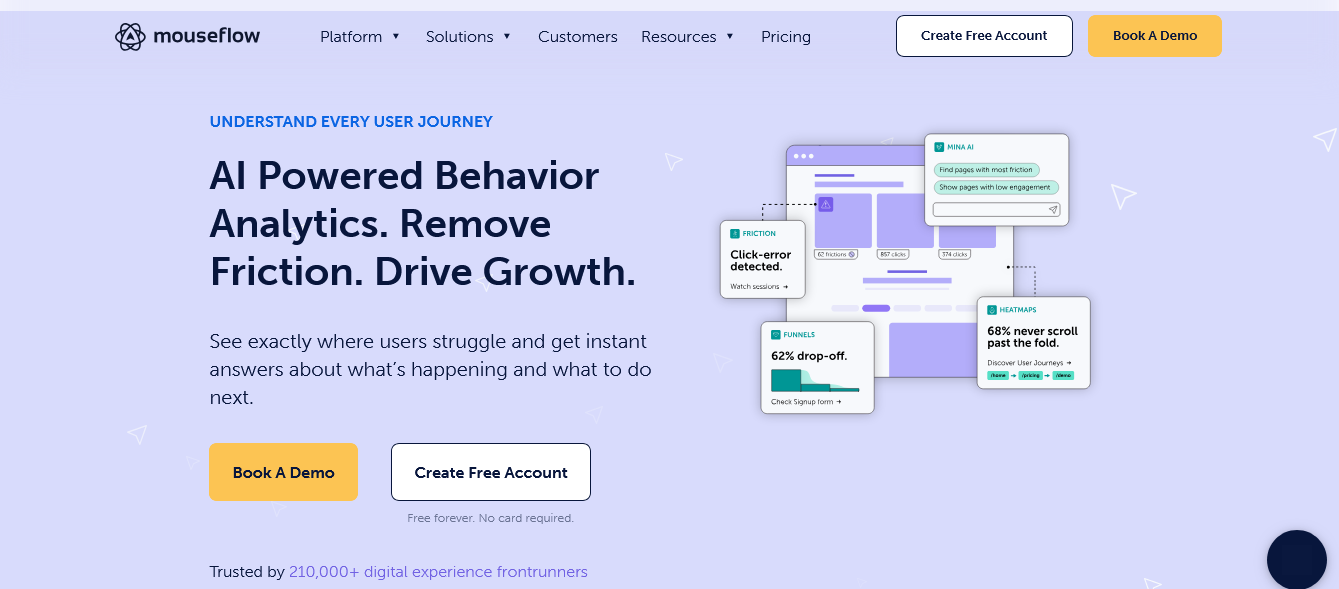
Best for: E-commerce and SaaS teams who need to understand conversion funnel drop-offs
What sets Mouseflow apart:
While Hotjar and Clarity are strong generalists, Mouseflow goes deeper on two specific areas: form analytics and funnel tracking. If forms and multi-step conversion paths are critical to your business, Mouseflow’s depth in this area is unmatched.
What Mouseflow includes:
6 heatmap types (more than any competitor):
- Click maps
- Scroll maps
- Movement maps (mouse movement correlates with eye tracking)
- Attention maps (combined engagement data)
- Geographic maps (visitor locations)
- Live heatmaps (real-time overlay on your live site)
Form analytics:
- Field-by-field analysis of where users abandon forms
- Time spent per field (which questions make people pause or give up)
- Error rates for each field
- Completion rates before and after changes
Funnel tracking:
- Define conversion funnels and see exactly where visitors drop off
- Filter funnel analysis by traffic source, device, geography
- Compare funnel performance over time
Session recordings:
- 100% of sessions recorded (no sampling)
- Filter by frustration signals, specific pages, traffic sources
Reality check: Mouseflow is significantly more expensive than Clarity or Hotjar. Justified for teams where form optimization and funnel analysis are core business needs. Overkill for simple informational websites.
Pricing: Paid plans start at $39/month.
Best for: E-commerce stores with multi-step checkout, SaaS companies with complex signup flows, any business where form completion rates directly impact revenue.
8. Lucky Orange – The All-In-One Conversion Suite
Best for: Small to mid-size businesses wanting everything in one affordable platform
The Lucky Orange pitch:
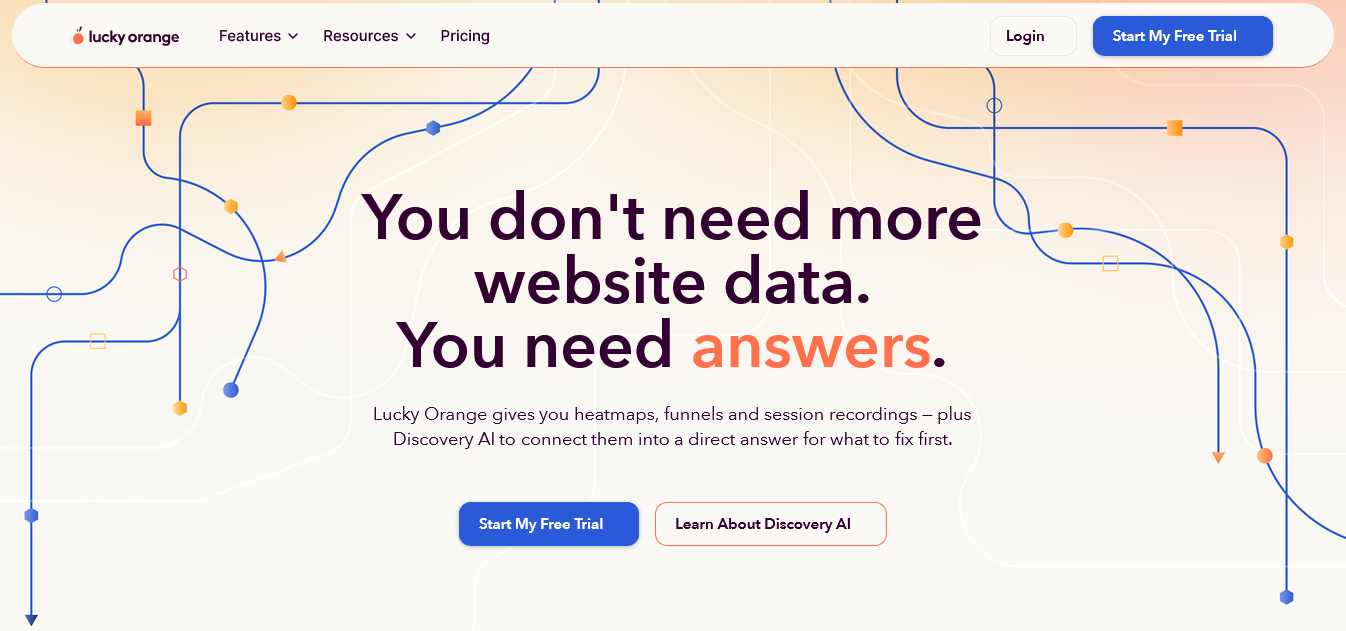
Lucky Orange competes with Hotjar on features but wins on price at the entry level. It packs heatmaps, session recordings, live chat, survey tools, conversion funnels, and real-time visitor monitoring into one platform without the enterprise price tag.
What Lucky Orange includes:
- Dynamic heatmaps: Track clicks, scrolls, and mouse movement, including on dynamic page elements that change based on user actions (something static heatmaps miss)
- Session recordings: Watch individual visitor journeys with context
- Real-time live view: See active visitors on your site right now and what they’re doing
- Conversion funnels: Define conversion paths and identify where users exit
- Surveys and polls: Collect direct feedback from visitors
- Live chat: Engage visitors in real-time based on behavior triggers
The real-time advantage:
Lucky Orange’s live view is genuinely useful. See a visitor spending 8 minutes on your pricing page without converting? Trigger a chat message. It turns passive observation into active engagement.
Limitations:
- Data sampling on lower plans
- Less sophisticated than Mouseflow for form analytics
- No visitor identification (B2B company-level data)
Pricing: Paid plans start at $39/month.
Best for: Small business owners and lean marketing teams who want behavioral analytics, real-time monitoring, and live chat without paying for separate tools.
How To Choose The Right Website Visitor Tracking Tool (Without Losing Your Mind)
The right tool depends entirely on what question you’re trying to answer:
“Where does my traffic come from and how are my search rankings performing?” → CrawlWP for organic traffic from Google, Bing, and Yandex + Google Analytics for all traffic sources
“What do visitors actually DO once they arrive?” → Microsoft Clarity (free) or Hotjar (if you need user surveys too)
“Which companies are visiting my B2B website?” → Leadfeeder/Dealfront
“Why are people not completing my checkout or signup form?” → Mouseflow (best form analytics)
“I want to test fixes, not just find problems?” → Crazy Egg (A/B testing + heatmaps)
“I want everything in one budget-friendly tool?” → Lucky Orange
Winning Stack For Most WordPress Sites
The complete picture for under $100/year:
- CrawlWP ($59/year) — Organic traffic tracking across Google, Bing, Yandex inside WordPress
- GA (Free) — Total traffic analytics from all sources
- Microsoft Clarity (Free) — Behavioral analytics, heatmaps, session recordings
- Google Search Console (Free) — Search performance data
Total: $59/year
This stack answers every critical question:
- Where does traffic come from? (Google Analytics)
- How are rankings and keywords performing? (CrawlWP)
- What do visitors do on the site? (Clarity)
- Which pages need optimization? (All four, together)
You don’t need to spend $200/month to understand your visitors. You need the right tools answering the right questions.
The New Factor: AI Search Traffic Is A New Variable
Here’s something most visitor tracking articles still haven’t caught up to: AI search engines are now a legitimate traffic source.
ChatGPT, Perplexity, Google AI Overviews, Microsoft Copilot, and Gemini are all sending visitors to websites in 2026. Traditional Google Analytics reports often misclassify this as “direct” traffic, making it invisible.
The implication for website visitor tracking:
If your Google Analytics “direct” traffic has grown mysteriously over the past 12 months without explanation, part of that growth is almost certainly AI referral traffic. You’re getting credit for it in your numbers, but you don’t know it’s happening or which content is driving it.
The fix: Pair CrawlWP (to ensure your content gets indexed fast so AI systems can find and cite it) with tools like Similarweb’s AI Traffic Checker (to see which AI engines send you visitors) for a complete picture of your organic discovery.
Your 30-Day Action Plan
Week 1: Set up your foundation
- Install CrawlWP and connect to Google Search Console, Bing, and Yandex
- Ensure GA is properly configured on your site
- Install Microsoft Clarity (takes 5 minutes, completely free)
- Identify your top 5 traffic-driving pages
Week 2: Audit existing performance
- Review CrawlWP’s top keywords report; which are your Winners? Which are Losers?
- Check Google Analytics for traffic source breakdown
- Watch 10 session recordings in Clarity for your most-visited pages
- Review heatmaps for your top landing pages
Week 3: Identify the gaps
- Find keywords with high impressions but low CTR (title/meta optimization opportunity)
- Find pages with high traffic but low conversion (UX optimization opportunity)
- Check device performance; any mobile/desktop performance gap?
- Review geographic data; any unexpected international traffic worth targeting?
Week 4: Take action
- Optimize title tags and meta descriptions for low-CTR keywords
- Fix UX issues identified in session recordings
- Upgrade underperforming pages based on behavioral data
- Plan content targeting keywords ranking positions 11-20
Ongoing:
- Monitor organic traffic weekly in CrawlWP
- Review Google Analytics monthly for traffic trend shifts
- Watch session recordings on any newly published content
- Check for new keyword ranking opportunities quarterly
FAQs
What is website visitor tracking?
Website visitor tracking is the process of monitoring and analyzing how users find, navigate, and interact with your website. It covers everything from how visitors discover your site (organic search, social, paid) to what they do once they arrive (pages visited, clicks, scroll depth, time on site). Different tools track different aspects; some focus on traffic sources, others on behavioral patterns, others on visitor identification.
Are website visitor tracking tools legal?
Yes, when implemented correctly. Most behavioral analytics tools (Google Analytics, Clarity, Hotjar) comply with GDPR and other privacy regulations through cookie consent mechanisms and data anonymization.
SEO tracking tools like CrawlWP use official API connections to search engines, so they require no user-level tracking at all. Always include a privacy policy and cookie consent banner that discloses your tracking tools.
Do visitor tracking tools slow down my website?
Modern tracking tools are designed to load asynchronously; they don’t block your page from rendering while they initialize. The performance impact is typically minimal (under 50ms for most tools).
The exception is running too many tracking tools simultaneously, which creates cumulative overhead. The stack of CrawlWP + Google Analytics + Clarity has negligible performance impact.
What’s the difference between website visitor tracking and website analytics?
Website analytics (Google Analytics) tells you aggregate numbers: how many visitors, which pages, which sources. Website visitor tracking digs deeper: session recordings show individual journeys, heatmaps show where people click, and behavioral tools reveal the “why” behind analytics numbers.
Both are necessary; analytics shows you what’s happening, tracking shows you why.
Can I track competitor website traffic?
Not with the tools on this list; they track your own site. For competitive traffic analysis, you need tools like Similarweb or SEMrush that estimate competitors’ traffic using aggregated data.
For your own site’s data, the tools here provide significantly more accurate and detailed information.
What is the best free website visitor tracking tool?
For behavioral analytics: Microsoft Clarity (unlimited sessions, heatmaps, session recordings, completely free). For SEO and organic traffic tracking: CrawlWP free version (Google, Bing, Yandex integration).
For complete traffic analytics: GA (free, unlimited). Using all three costs nothing and covers most tracking needs.
How many visitor tracking tools do I actually need?
Minimum two, maximum four. You need one tool to track where traffic comes from (CrawlWP + Google Analytics) and one to track what visitors do once they arrive (Clarity or Hotjar).
B2B companies may add a visitor identification tool (Leadfeeder). Adding more tools beyond that creates data overload without proportional insight.
How long before visitor tracking tools show useful data?
Behavioral analytics tools (Clarity, Hotjar) start showing useful heatmaps and recordings within days of installation; you need sufficient traffic volume for patterns to emerge. SEO tracking tools like CrawlWP show data immediately upon connection.
Generally, 2-4 weeks of data gives you enough to identify meaningful patterns.
Do I need coding skills to use these tools?
No. CrawlWP installs like any WordPress plugin. Clarity and Hotjar provide a single JavaScript snippet to paste into your site header (most WordPress themes and page builders have dedicated fields for this).
Google Analytics integrates through a simple code snippet or Google Tag Manager. Most tools offer step-by-step setup guides that require no coding knowledge.
What’s the most important metric to track?
It depends on your goal. For SEO growth: track organic traffic, keyword rankings, and CTR (CrawlWP). For conversion optimization: track where visitors drop off and what they click (Clarity). For overall business health: track sessions, traffic sources, and goal completions (Google Analytics).
There’s no single “most important” metric; the right metric answers the question you’re actually asking.