
The four tables on the Google tab of SEO Stats let you break your search data into specific keywords, pages, countries, and devices. This reference explains what each table contains, how to read the metrics and comparison badges, and how to filter, sort, search, copy, and export the data.
For the date selector, summary cards, chart, and overall dashboard workflow, see Reading the SEO Stats dashboard.
Open the four tables
Go to CrawlWP > SEO Stats, make sure Google Stats is selected, and scroll below the chart. All four tables use the date range currently selected at the top of the page.
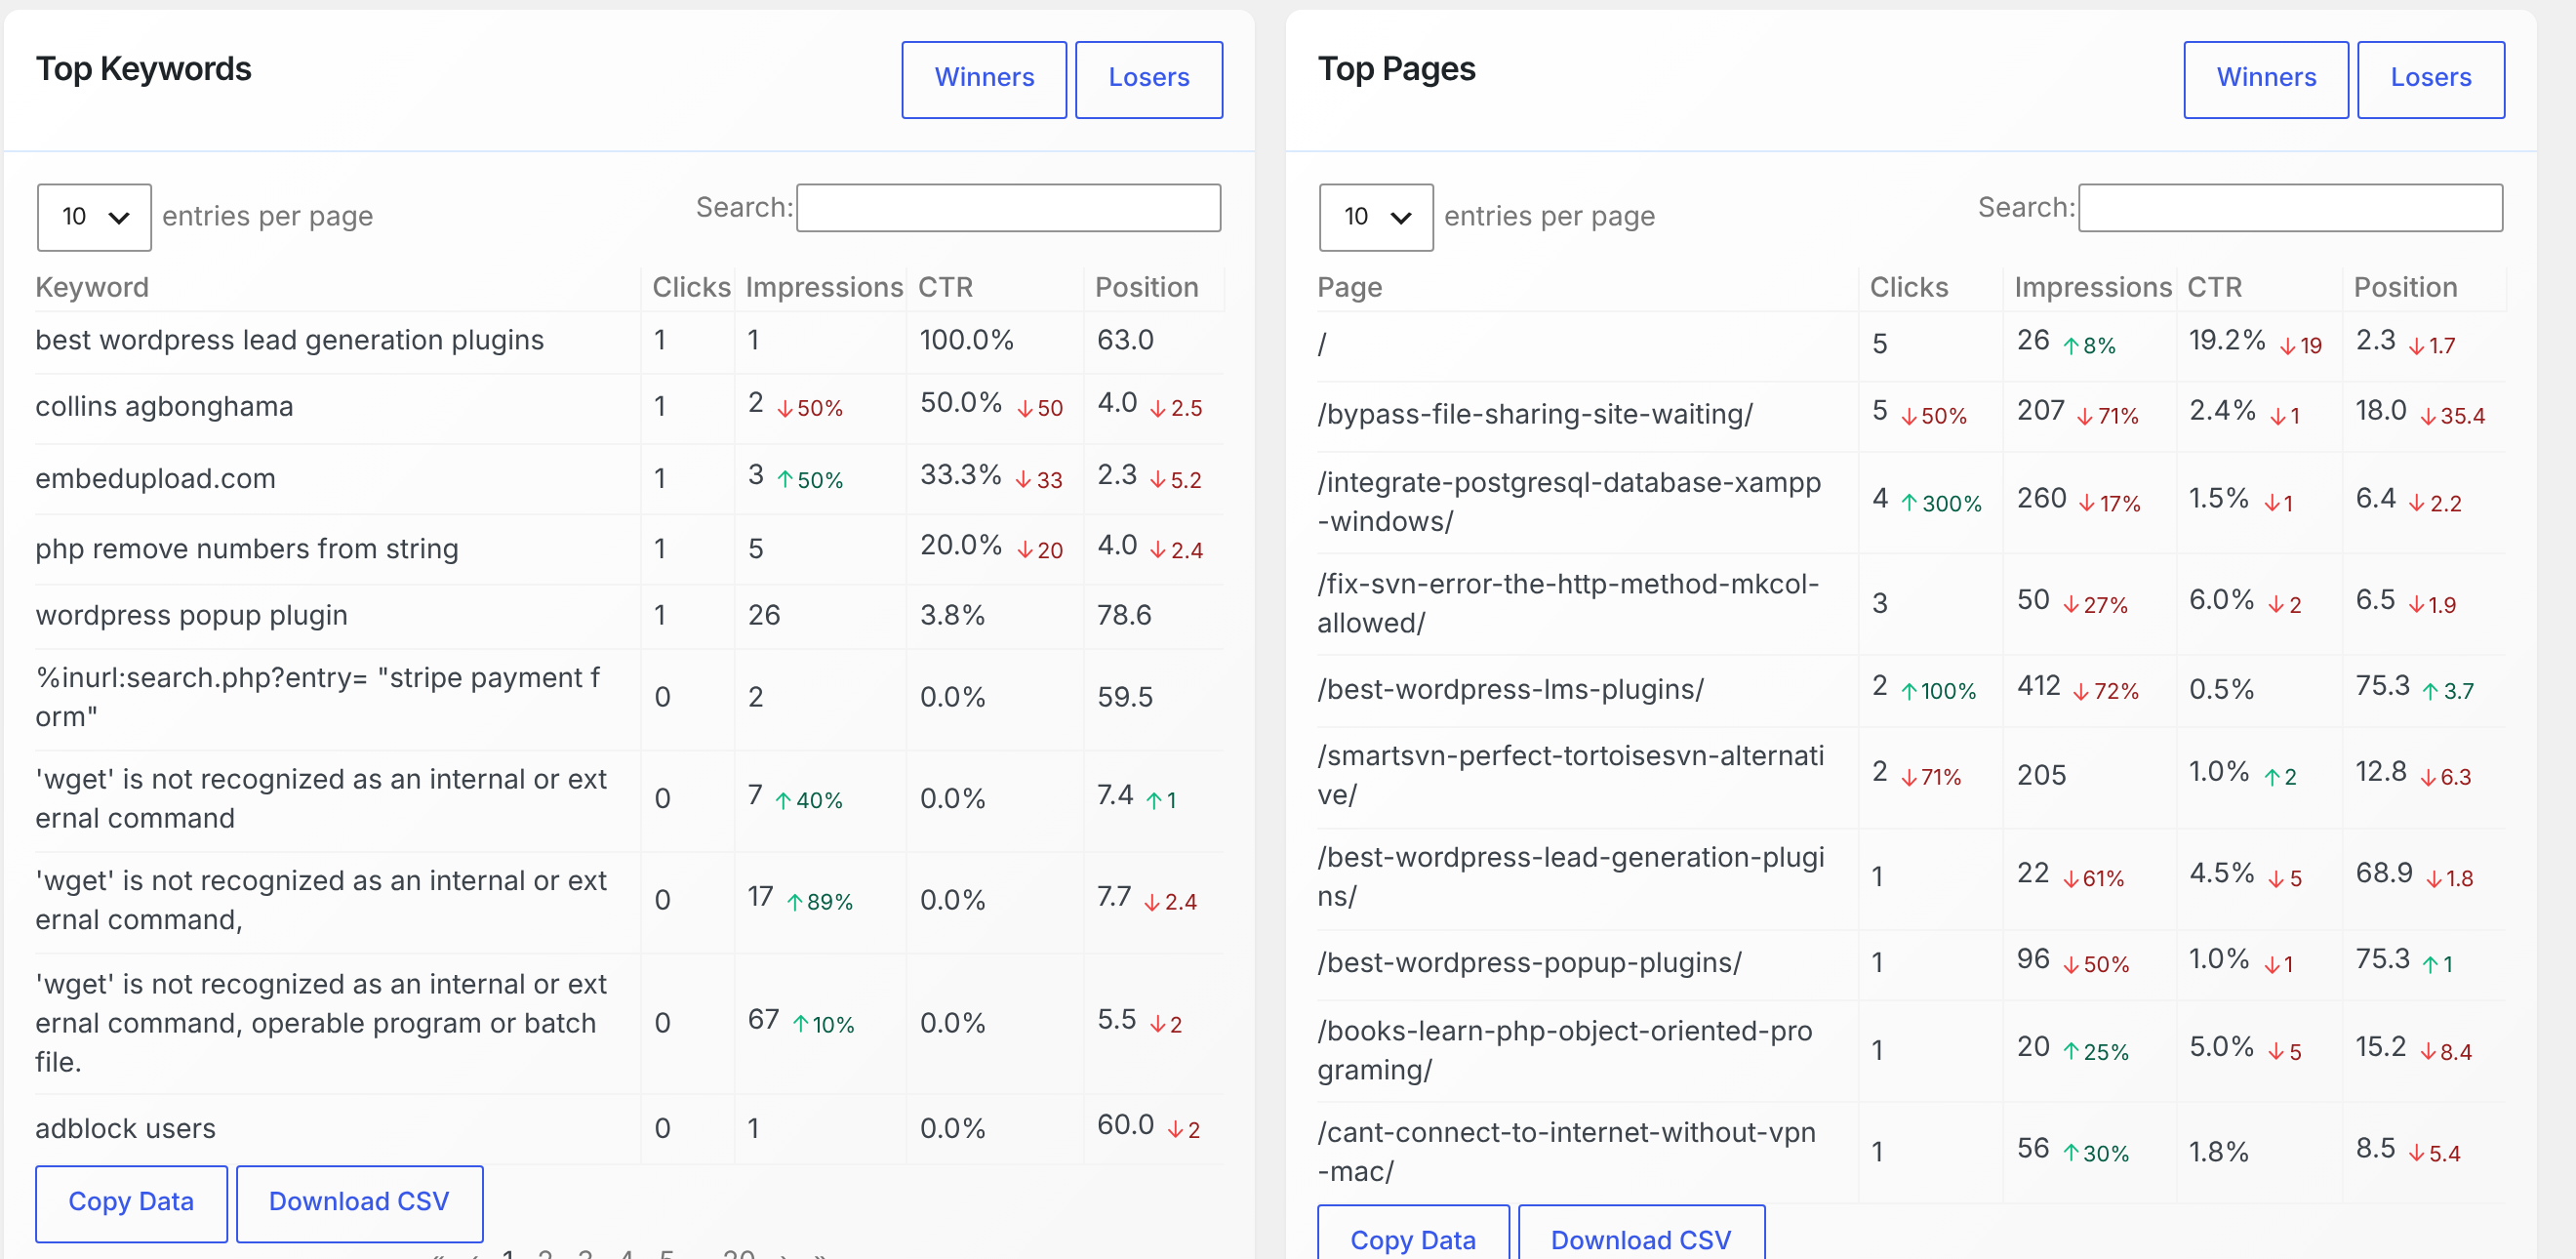
What each table shows
| Table | First column | What each row represents |
|---|---|---|
| Top Keywords | Keyword | A search term for which your site appeared in Google results |
| Top Pages | Page | A page from your site that appeared in Google results |
| Top Countries | Country | The country of the searcher, shown with its flag |
| Devices | Device | DESKTOP, MOBILE or TABLET |
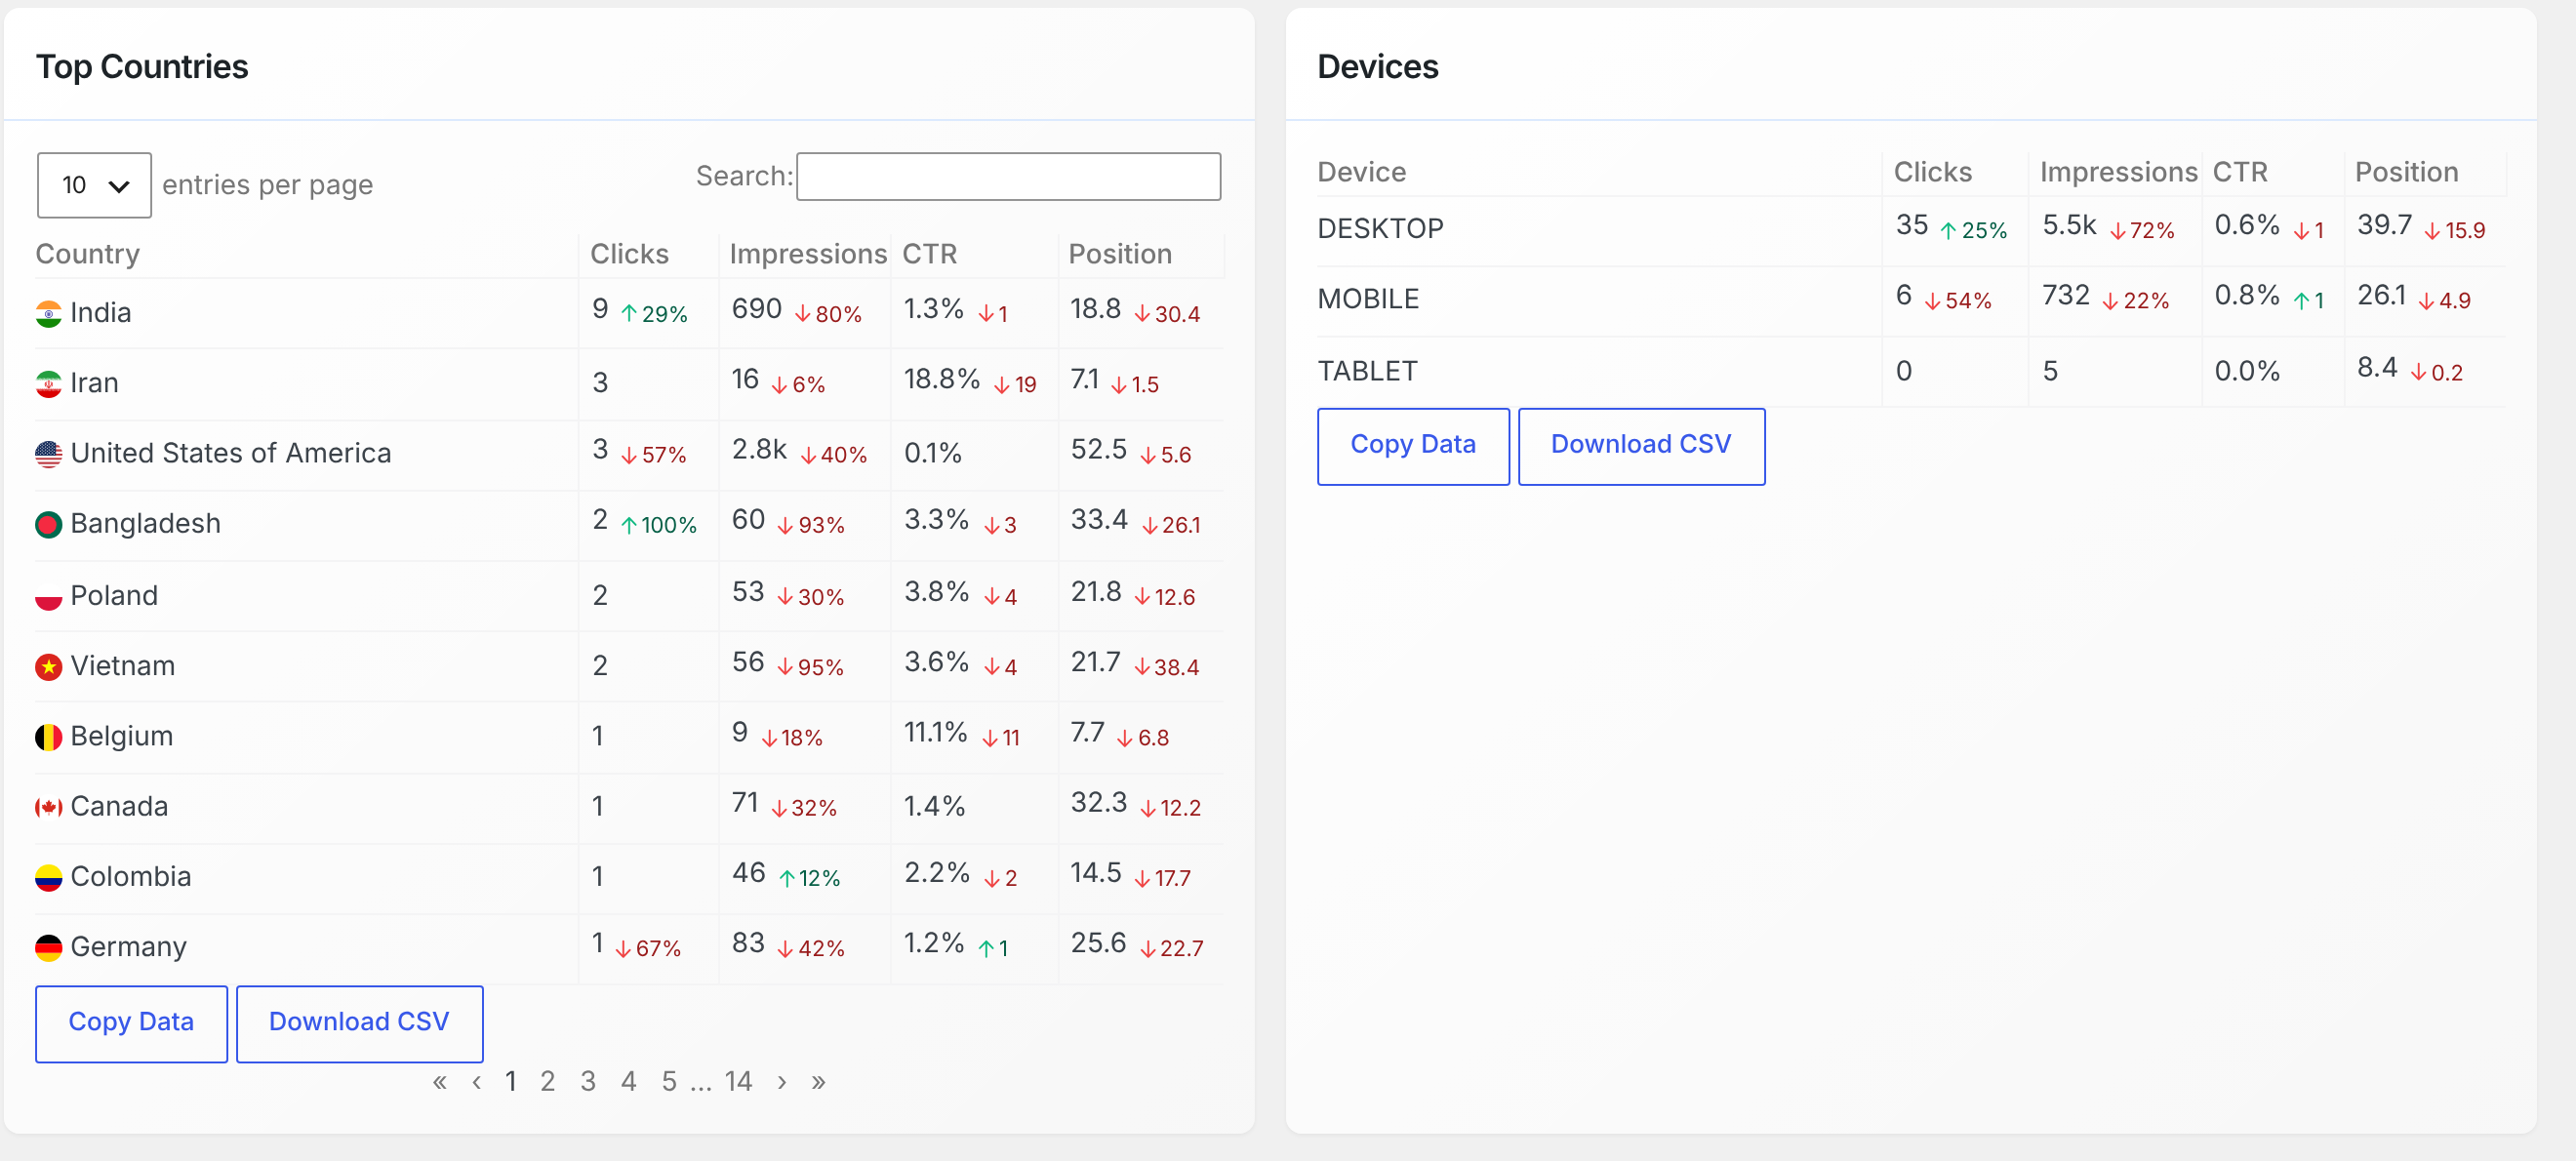
Changing the date range changes the data in all four tables. Select a different period at the top of the dashboard and click Filter to load the new results.
Understand the metrics
| Column | What it shows |
|---|---|
| Clicks | The number of clicks from Google results to your site |
| Impressions | The number of times your site appeared in Google results |
| CTR | Clicks divided by impressions, expressed as a percentage |
| Position | Your site’s average position in the results; lower is better |
Large numbers are shortened on screen. For example, 5,500 may be displayed as 5.5k.
Many values also have a small badge showing the change from the previous period of the same length. Clicks and Impressions use percentage changes, while CTR and Position show the difference itself. CrawlWP does not show a badge when there is no value in the previous period to compare with, when the previous value was 0, or when the change rounds to 0. Changes to Clicks, Impressions, and CTR are rounded to whole numbers, so a CTR change of less than half a percentage point can disappear from the display.
Pay attention to the arrows
The comparison indicators in these tables do not always have the same meaning as the indicators on the summary cards at the top of SEO Stats.
- For Clicks and Impressions, green and up indicate growth.
- For CTR, a green up arrow means the CTR fell.
- For Position, a green up arrow means the position number increased. Because a lower position is better, that represents a worse ranking.
How many rows can you see?
- Top Keywords and Top Pages can contain up to 200 rows, beginning with the entries that received the most clicks.
- Top Countries can contain up to 200 countries. When Google cannot identify the country, it is shown as Unknown.
- Devices contains up to three rows: DESKTOP, MOBILE, and TABLET.
- Google hides some search queries for privacy. Because of this, the keyword clicks shown in Top Keywords may not add up to the total displayed on the Clicks card.
Find winning and losing pages or keywords
Top Keywords and Top Pages have two additional controls that make it easier to spot major changes: Winners and Losers.
- Winners sorts the rows so the entries with the largest percentage increase in clicks appear first.
- Losers sorts the rows so the entries with the largest percentage decrease in clicks appear first.
Click the active button again to return to the normal click-based sorting.
Because the comparison is based on percentage change, the biggest winner is not necessarily the item that gained the most clicks. For example, a keyword that increased from 1 click to 3 has a larger percentage increase than one that increased from 100 clicks to 150. Keywords and pages with no clicks in the previous period are treated as having no change, so they do not appear as winners.
Turn a row into a dashboard filter
Clicking an item in any of the four tables filters the rest of the dashboard around that item. You can select a keyword, page, country, or device.
After a filter is applied, the totals, chart, and other three tables only count data for the selected item. For example, selecting a page lets you investigate which keywords, countries, and devices contributed to that page’s search activity.
In Top Pages, the small arrow next to a page opens that page in a new browser tab.
For instructions on removing active filters, see Reading the SEO Stats dashboard.
Search and sort the rows
- Use Search to find rows containing a particular word or phrase.
- Click a column heading to sort by that column. Click it again to reverse the order.
- Change entries per page to decide how many rows are displayed at once. The default is 10.
Copy or download the results
- Click Copy Data to copy the table to your clipboard for use in a spreadsheet or another document.
- Click Download CSV to save the table as a CSV file.
Copying and downloading include all rows that match your current search, not only the rows visible on the current page. The exported data also uses full numbers rather than the shortened values shown on screen.
On Top Keywords and Top Pages, the copied and downloaded data includes an additional Clicks Diff column showing the percentage change in clicks.
Common questions
Why do the clicks in Top Keywords not equal the Clicks total? Google hides some search queries for privacy, so the visible keyword rows do not necessarily account for every click included in the overall total.
Why is a keyword I know I rank for missing? Google may hide rare queries for privacy, and Top Keywords displays a maximum of 200 rows. Try filtering by the page that ranks for the missing query.
Why does a green Position arrow sometimes represent a bad result? Position is a ranking number, so a larger number means a lower ranking. The tables therefore require the opposite interpretation from growth metrics such as clicks.
Why are the exported numbers longer than the numbers on screen? Large values are abbreviated only for display. Copying and downloading use the full underlying numbers and, for Top Keywords and Top Pages, include Clicks Diff.
Troubleshoot empty or unexpected results
The tables are empty. Check the Google API connection under CrawlWP > Settings > API Settings and try selecting a longer date range.
The figures do not match Search Console. CrawlWP keeps each Search Console response for up to 12 hours. Search Console can also total and present some reports differently, so small differences are possible.
Use the tables to investigate search performance
The four tables work best as a drill-down tool. Start with Top Keywords or Top Pages to identify what is generating clicks, use Winners and Losers to spot meaningful changes, and then filter by a row to see the rest of the dashboard in context.
For the full Google report, including the date filter, summary cards, chart, and filter controls, return to Reading the SEO Stats dashboard.