
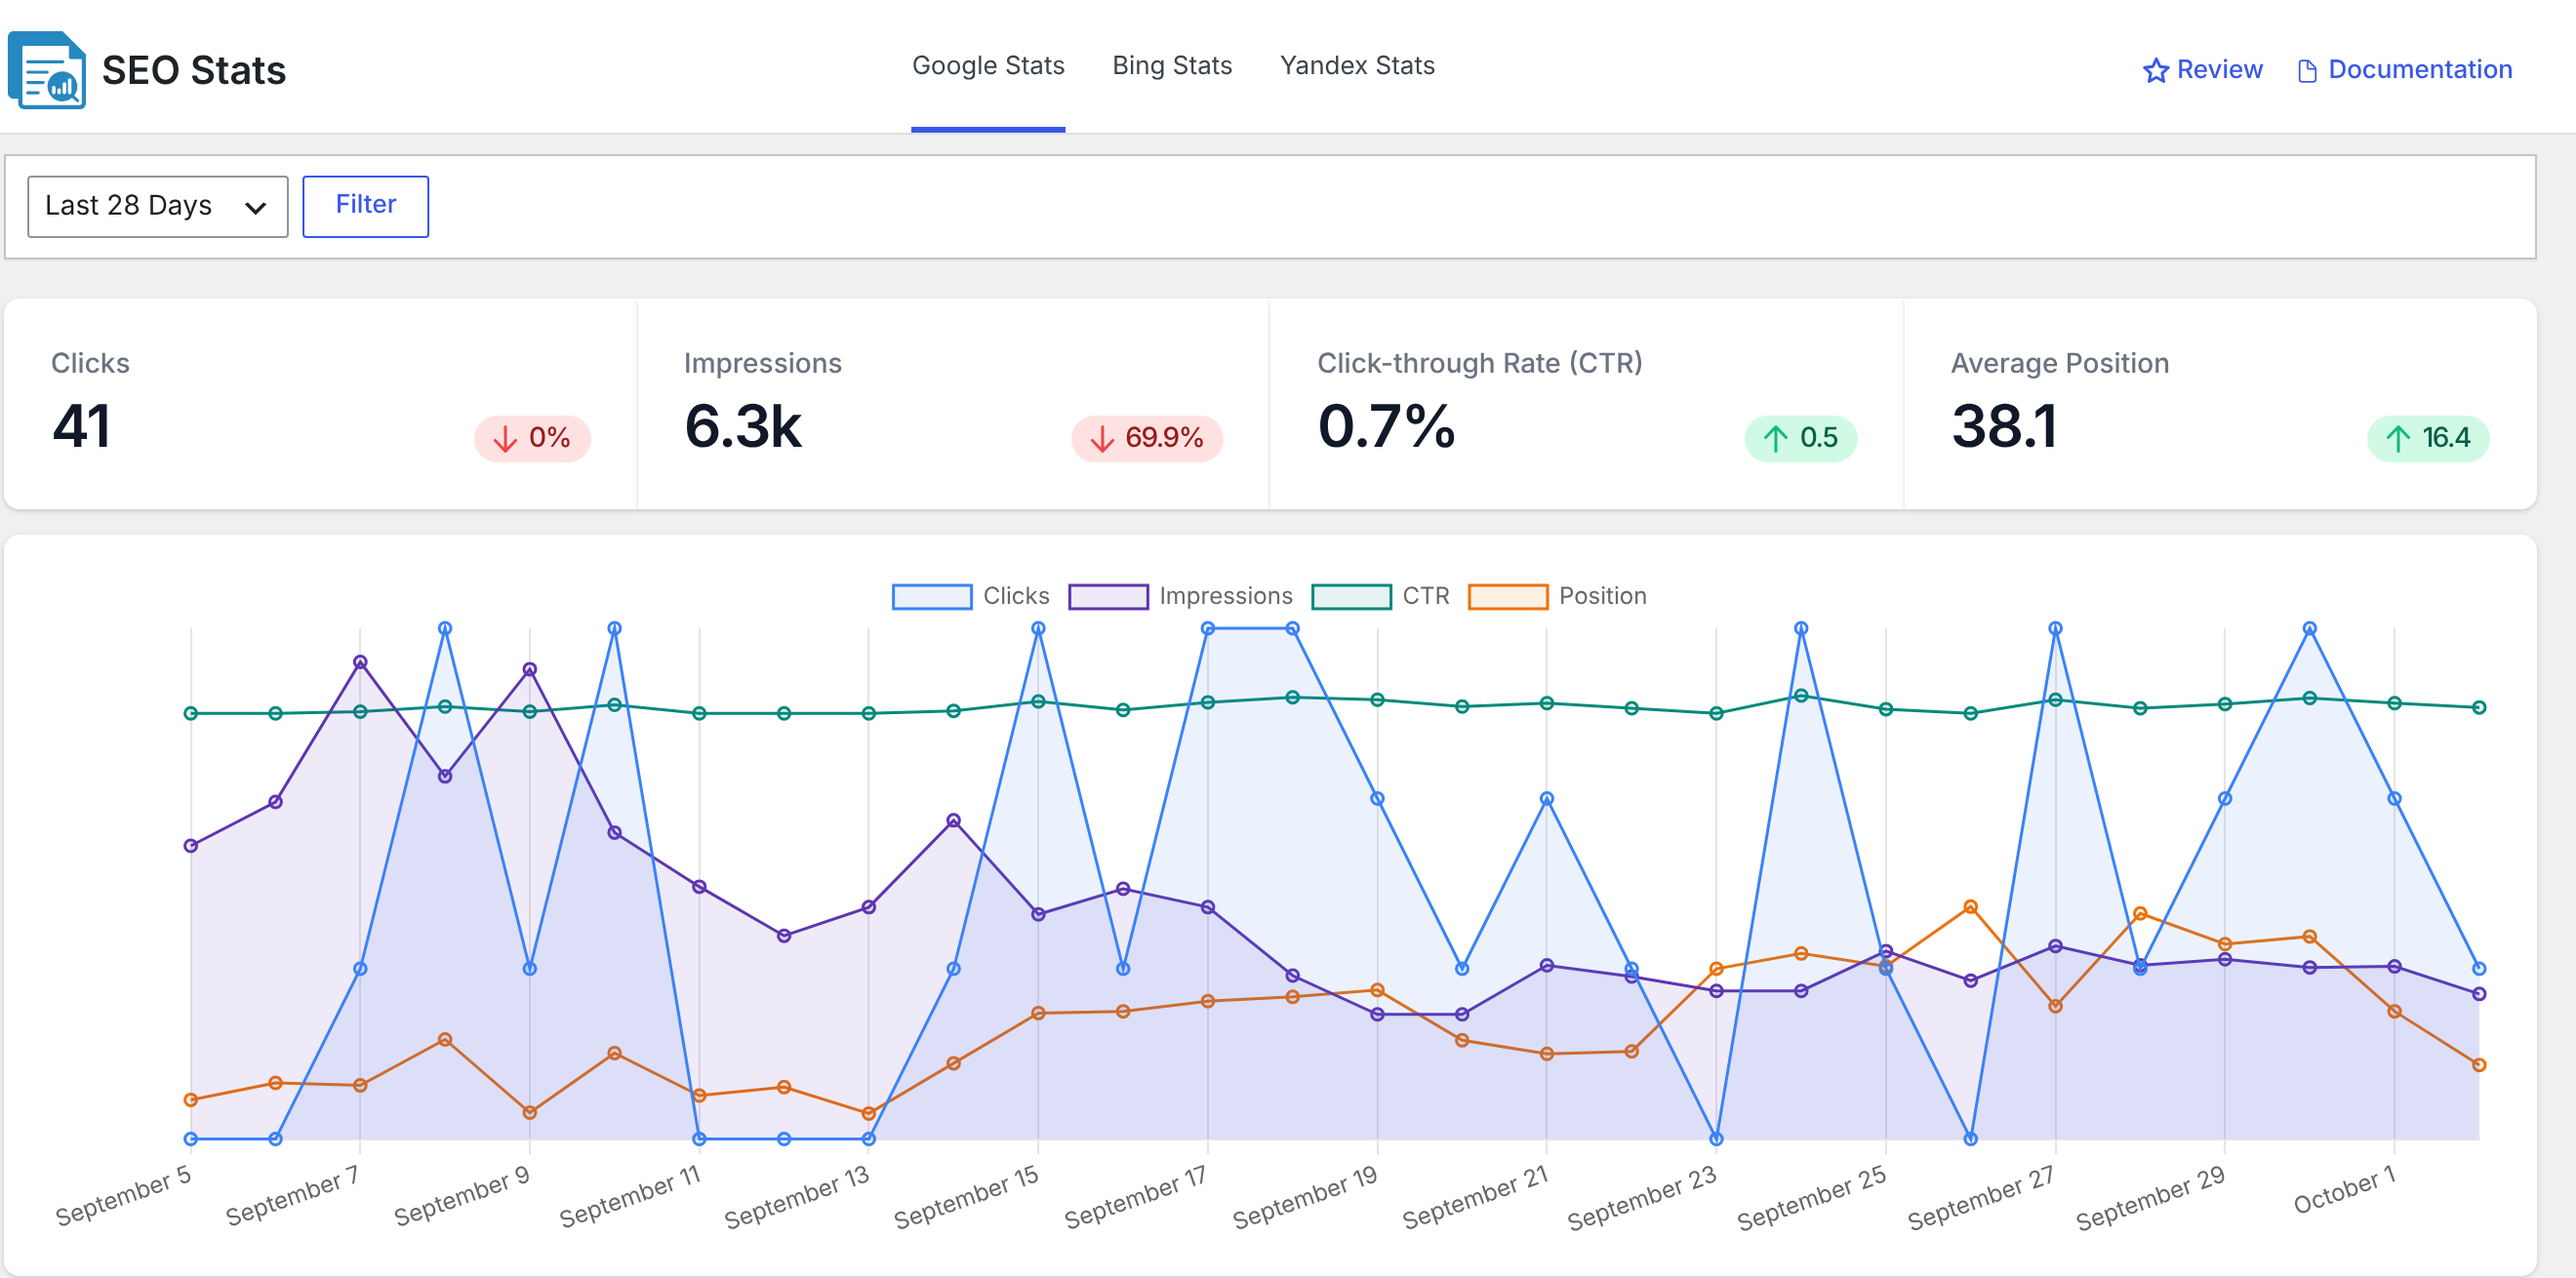
The SEO Stats page gives you a broader view of how your site appears in Google search. In CrawlWP Premium, the Google tab combines search totals, a daily chart, and tables that let you narrow the report to a particular page, keyword, country, or device.
Connect Google before opening the report
The Google report is powered by Google Search Console data. Connect the Google API under CrawlWP > Settings > API Settings using a Google account that has access to the site in Search Console. For setup instructions, see Integrating WordPress with Google Search API.
When there is no connection, CrawlWP displays the message “You need to connect with the Google API to view reports.” and provides a Connect with Google API button.
Open Google Stats
- Go to CrawlWP > SEO Stats.
- Select Google Stats at the top of the page. This tab is selected first by default.
Set the reporting period
The date control at the top lets you decide how much Search Console data to include in the report.
- Choose Last 7 Days, Last 28 Days, Last 3 Months, Last 6 Months, Last 12 Months, Last 16 Months or Custom.
- For Custom, enter the From and To dates using
YYYY-MM-DD, or select the dates from the calendar. - Click Filter to load the selected range.

Last 28 Days is selected by default. Preset ranges end on yesterday, using UTC. Search Console can take two or three days to finish reporting recent data, so the newest days may initially look lower than they eventually will.
Last 16 Months is the longest preset because Search Console keeps 16 months of data.
Read the four summary cards
| Card | What it measures |
|---|---|
| Clicks | The number of clicks from Google search results to your site |
| Impressions | The number of times a link to your site appeared in Google search results |
| Click-through Rate (CTR) | Clicks divided by impressions, shown as a percentage |
| Average Position | The average position of your site’s highest-ranking result; position 1 is the top and lower is better |
The cards compare your selected range with the immediately preceding period of the same length. For example, a Last 28 Days report is compared with the 28 days directly before it.
- Clicks and Impressions show the difference as a percentage.
- Click-through Rate (CTR) shows the change in percentage points. A move from 0.2% to 0.7% therefore appears as 0.5.
- Average Position shows how many places the average position changed. A green up arrow indicates an improvement because the position number became smaller.
The arrows use green for an improvement and red for a drop. Some comparisons have special results when there is no movement or no previous data.
- When Clicks or Impressions have not changed, or there is no earlier data, the card shows a red down arrow with 0%.
- When Click-through Rate (CTR) or Average Position has not changed, the card shows a red down arrow with 0.
- When there is no earlier data, Click-through Rate (CTR) shows a green up arrow equal to the current CTR, while Average Position shows a red down arrow equal to the current position.
Use the chart to follow daily movement
The chart breaks the selected range down by day and plots Clicks, Impressions, CTR, and Position. Hover over a point or day to see the figures for that date.
The legend is interactive: click a metric name to hide its line or show it again. Position is plotted upside down, so an improving ranking moves upward on the chart.
Narrow the dashboard with the tables
Below the chart, CrawlWP lists your top keywords, pages, countries, and devices. These tables are where the site-wide report becomes a more focused investigation. For a reference to the table data, see Top keywords, pages, countries and devices (reference).
Click a keyword, page, country, or device to filter the dashboard by that item. The summary cards, chart, and remaining tables then recalculate around the active filter.
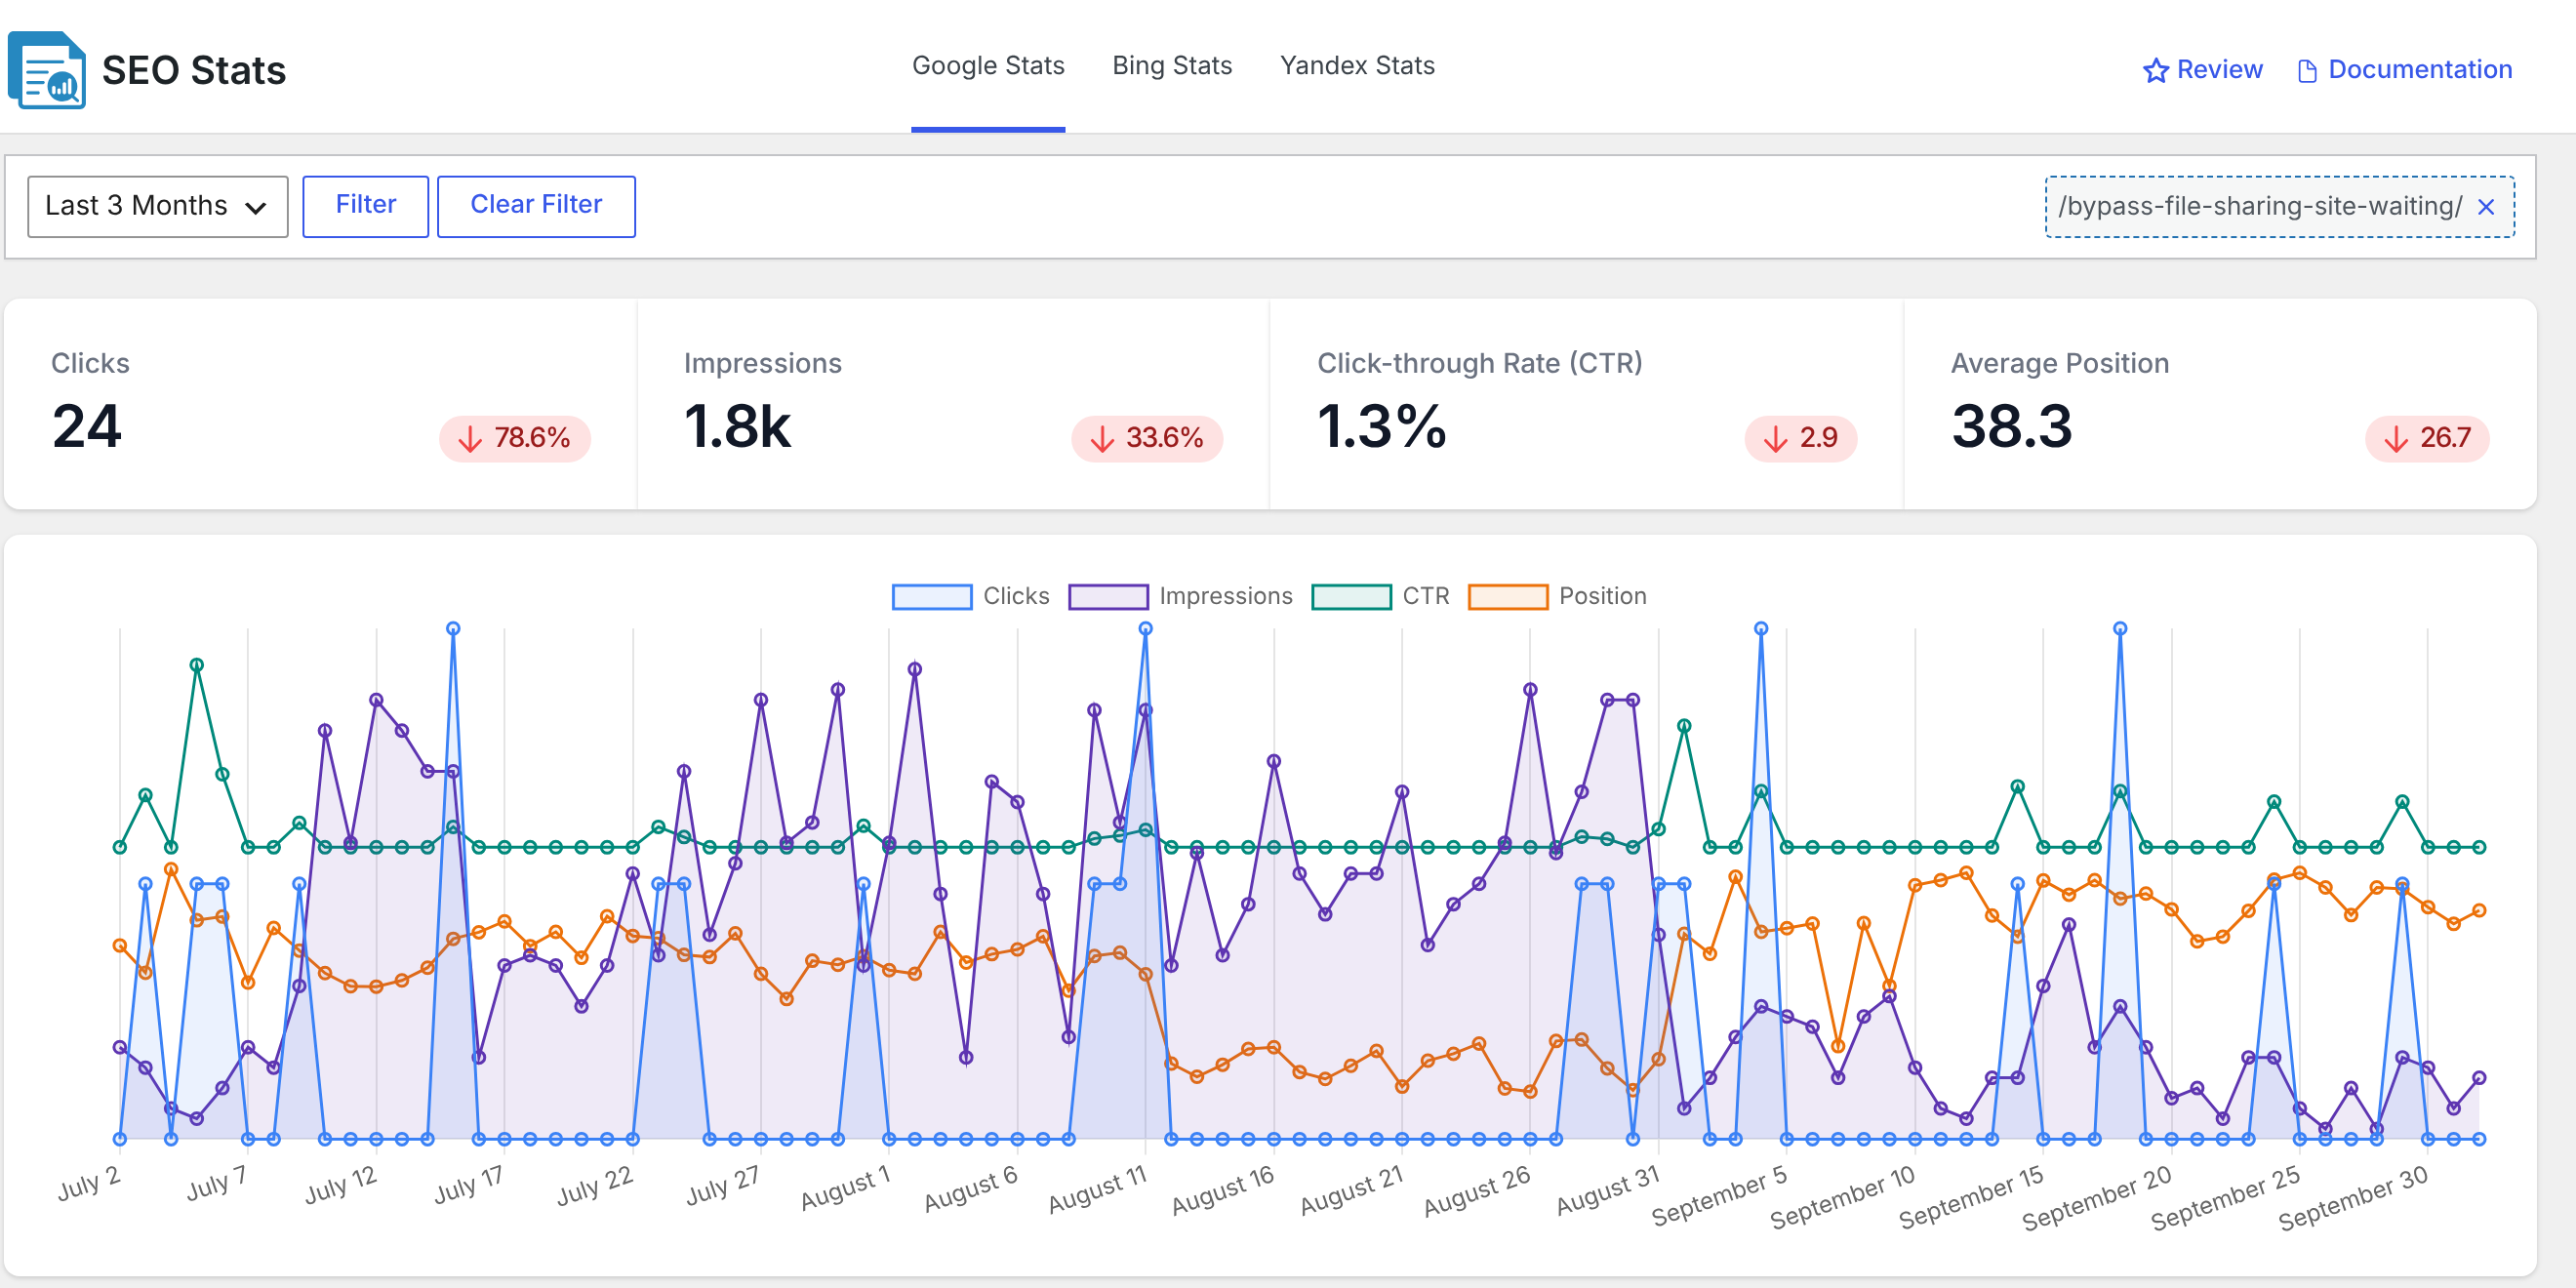
- The current filter appears at the top right. Click the × beside it to remove that filter.
- Filters can be combined. For example, selecting a page and then a country shows performance for that page in the selected country.
- After changing the date range, a Clear Filter button appears beside Filter. It restores Last 28 Days and removes all filters.
There is one important exception when changing dates: only a keyword filter is retained after you click Filter. Any page, country, or device filter is cleared, so select those again for the new date range.
Know when the numbers were last updated
CrawlWP caches each Search Console response for up to 12 hours. That reduces repeated requests and helps the report load faster, but it also means newly available Search Console data may take up to 12 hours to appear in CrawlWP. There is no refresh button for forcing an immediate update.
The numbers can also differ slightly from what you see directly in Search Console because Search Console applies its own grouping and rounding when presenting some reports.
Troubleshoot common dashboard problems
Everything shows 0. Confirm that the Google API is connected and that the service account can access the site in Search Console. Connection problems are recorded under CrawlWP > Settings > Log; look for google-webmaster in the SE column. See Reading the indexing submission log.
The page says “You need to connect with the Google API to view reports.” Add the Google JSON key under API Settings > Google API and click Save Changes.
Recent changes in Search Console are not visible. CrawlWP may still have the previous response cached. Allow up to 12 hours for the dashboard to refresh.
A custom range will not load. Enter the dates in YYYY-MM-DD format and ensure From comes before To. CrawlWP does not validate the dates, and using another format can prevent the page from loading. Open CrawlWP > SEO Stats again from the WordPress menu if this happens.
A practical way to use the dashboard
Start with the four cards to see whether overall search performance has moved compared with the previous period. Use the chart to identify days when the change happened, then click a page, keyword, country, or device to find where the movement is coming from.
For an individual post or page, the Insights tab in the CrawlWP SEO box provides a more convenient editor-side view. For the broader site report, return to SEO Stats and use its filters and tables to investigate the details.